

Transport Focus has published its 2025/26 Strategic Roads User Survey (SRUS), the annual health-check on how motorists experience England’s motorways and major ‘A’ roads. It’s built from car driver responses, so it isn’t aimed at the coach and bus sector directly. But operators running scheduled services, private hire, school contracts or community transport across the Strategic Road Network (SRN) will recognise almost every finding — and several of them carry real planning implications for the next five years.
The headline: things are getting better, but roadworks are still the weak link
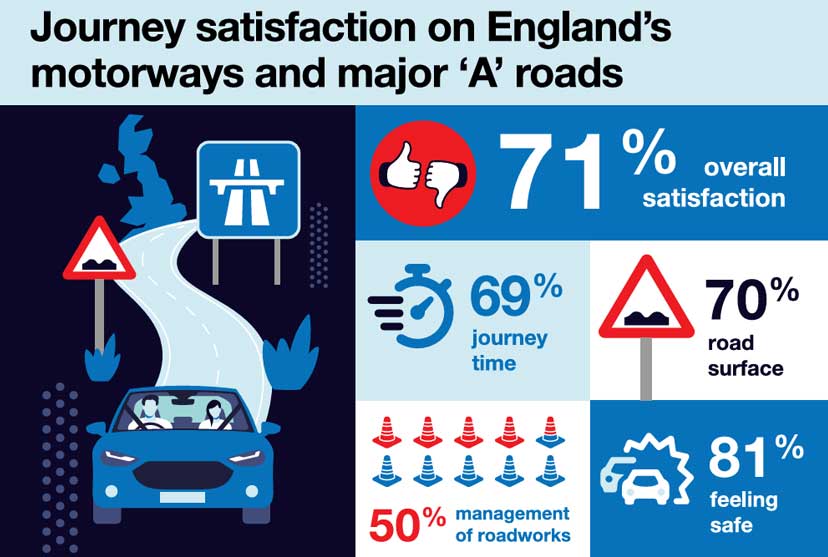
Overall satisfaction with SRN journeys rose to 71 per cent this year, up from 69 per cent, largely because National Highways finished its National Emergency Area Retrofit (NEAR) programme — the huge run of emergency-area works on all-lane-running smart motorways that dragged satisfaction down in 2024/25. Journey time satisfaction, road surface satisfaction and feelings of safety all improved too.
The one area that stayed stubbornly weak is roadworks management. Only half of drivers who passed through roadworks were satisfied with how they were handled, even though that’s an improvement on last year’s 46 per cent. For anyone running a timetable, that 50 per cent figure matters more than the headline number — journey time is, by a distance, the biggest driver of overall satisfaction in the survey, and roadworks are the single biggest threat to it.
Why this matters for scheduling and driver welfare
The survey quantifies something every operator already feels in their bones: 25% of journeys affected by roadworks lost 16 minutes or more, and drivers who hit roadworks were markedly less satisfied overall than those who didn’t. For a coach on a tight school run, rail-replacement contract or scheduled service, that’s the difference between a route that works and one that generates complaints, missed connections and driver stress.
Two operational cues from the report are worth building into route planning and driver briefings:

A five-year warning: RIS3 means more roadworks, not fewer
This is the point operators should take most seriously. National Highways is entering the third Road Investment Strategy (RIS3), covering April 2026 to March 2031, which means a “significant programme of renewals” and, by National Highways’ own admission, an increase in roadworks across the network over the period. Transport Focus is explicit that success won’t be judged on whether individual schemes finish on time and budget, but on whether disruption is coordinated across the network as a whole — planning and sequencing, clear communication, proportionate restrictions, and visible improvement once work is done.
For operators, that translates into a multi-year planning problem rather than a one-off inconvenience. Routes and contracts signed now should assume recurring, overlapping disruption on key corridors through to 2031, not just isolated schemes. Building schedule padding, monitoring National Highways’ regional works programmes, and flagging repeat problem routes to Transport Focus (which continues to gather and act on user evidence) are all worth doing proactively rather than reactively.
Smart motorways and safety: the picture is improving, cautiously
Satisfaction with journeys involving smart motorway sections has recovered strongly now NEAR is finished — up from 60 to 66 per cent, and all-lane-running sections specifically up from 59 to 67 per cent. Feeling safe on ALR motorways has also improved, narrowing the gap with conventional motorways, which the report links to the extra 151 emergency areas installed under NEAR. That’s a genuinely useful data point for operators reassuring passengers, staff or commissioning bodies who remain wary of smart motorways — the safety perception gap is closing, not widening.
Regional variation worth knowing for multi-region operators
For operators running services across several National Highways regions, the regional breakdown is a useful planning reference: the South West continues to have the highest overall satisfaction (75 per cent), while the North West, Midlands and M25 area are the weakest (all 69 per cent). Roadworks management satisfaction is broadly similar everywhere (44–52 per cent), so no region is currently “solved” — but the South West, South East and North West rate joint-highest for roadworks management, while the East (dragged down by the perennially poor A12 and A47) rates lowest for both roadworks and road surface.
Practical takeaways
The full report is available via Transport Focus’s data hub, including verbatim driver comments by road — useful reading for any operations manager building a picture of problem routes ahead.
Please fill in your details below and a member of our team will be in touch with you as soon as possible.


